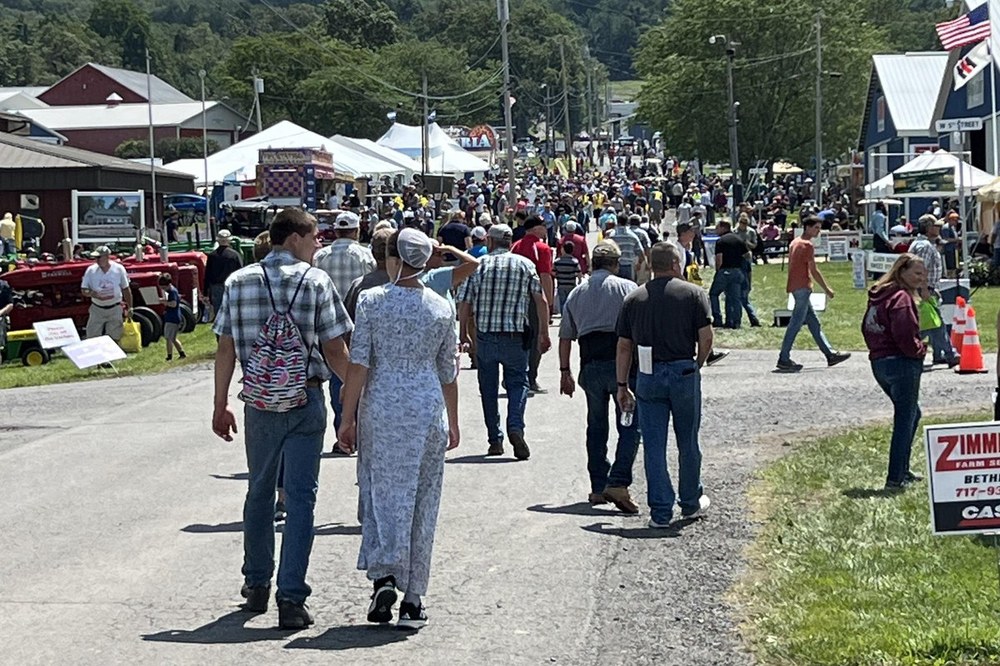
History of attendance at Ag Progress Days.

Main Street at Ag Progress Days
August 12-14, 2025
- 434 Exhibitors
- 42,000 Attendees
August 13-15, 2024
- 418 Exhibitors
- 44,000 Attendees
August 8-10, 2023
- 419 Exhibitors
- 44,000 Attendees
August 9-11, 2022
- 402 Exhibitors
- 45,000 Attendees (Tuesday 8,000; Wednesday 25,000; and Thursday 12,000)
August 10-12, 2021
- 415 Exhibitors
- 44,000 Attendees (Tuesday 12,000; Wednesday 22,000; and Thursday 10,000)
- First large Penn State event after Covid-19 Pandemic closure
- Travel restrictions were still in place for many companies due to Covid-19 or it's variant existing in the population.
- The vaccinated population of PA was at approximately 60% but no approved vaccine was available for children under 12...We sponsored a vaccination clinic at the Show.
- We increased sanitation and spacing between exhibits, encourage social distancing, and reduced interactive activities.
- Masks were required for all in indoor structures where airflow was limited. We encouraged masking of non-vaccinated persons attending the event during this unprecedented time.
August 9-12, 2020 (Virtual Event)
- In person event cancelled due to Covid-19 Pandemic in June and July was pivoted to a virtual program
- Virtual Event held August 9-12, 2020
- 257 Exhibitors of 2020 participated with an Enhanced Exhibitor Profile (46% of paid exhibitors)
- 9,100 attendees viewed the Ag Progress Days site the week of the show (19% of our normal audience)
- 21,000 visitors for the month of August viewed the exhibitor marketplace website (30% of our normal audience)
- 47 Live Webinars were hosted and 56 On-Demand Educational Resources by Penn State Extension (Approx. 1,500 registered viewers of Live Webinars averaging 30-40 attendees which attracted new audiences)
- Social Media Promotions: Facebook Event Invitations reached 2,000+, YouTube Ad reached 3,000+ and Penn State Extension Emails generated 4,000 unique clicks
August 13-15, 2019
- 490 Exhibitors
- 46,000 Attendees (Tuesday 9,000;Wednesday 24,000;Thursday 13,000)
August 14-16, 2018
- 510 Exhibitors
- 42,000 Attendees (Tuesday 8,000;Wednesday 25,000;Thursday 9,000)
August 15-17, 2017
- 508 Exhibitors
- 42,000 Attendees (Tuesday 12,000;Wednesday 20,000;Thursday 10,000)
August 16-18, 2016
- 511 Exhibitors
- 40,000 Attendees (Tuesday 10,000; Wednesday 22,000; Thursday 8,000)
August 18-20, 2015
- 499 Exhibitors
- 42,000 Attendees (Tuesday 11,000; Wednesday 23,000; Thursday 8,000)
August 12-14, 2014
- 478 Exhibitors
- 42,000 Attendees (Tuesday 9,000; Wednesday 23,000; Thursday 10,000)
August 13-15, 2013
- 493 Exhibitors
- 46,000 Attendees (Tuesday-12,000; Wednesday-24,000; and Thursday-10,000)
August 14-16, 2012
- 485 Exhibitors
- 45,000 Attendees (Tuesday-11,000; Wednesday-25,000; and Thursday-9,000)
August 16-18, 2011
- 450 Exhibitors
- 42,000 Attendees (Tuesday-10,000; Wednesday-24,000; and Thursday-8,000)
August 17-19, 2010
- 438 Exhibitors
- 45,000 Attendees (Tuesday-12,000; Wednesday-24,000; Thursday-9,000)
August 18-20, 2009
- 426 Exhibitors
- 43,000 Attendees (Tuesday-10,000; Wednesday-22,000; Thursday-11,000)
August 19-21, 2008
- 405 Exhibitors
- 44,000 Attendees (Tuesday-12,000; Wednesday-24,000; Thursday-8,000)
August 14-16, 2007
- 413 Exhibitors
- 48,000 Attendees (Tuesday-13,000; Wednesday-25,000; Thursday-10,000)
2026 Event Information
Dates
August 11, Tuesday 9:00 a.m. - 5:00 p.m.
August 12, Wednesday 9:00 a.m. - 7:00 p.m.
August 13, Thursday 9:00 a.m. - 3:00 p.m.
Location
Russell E. Larson Agricultural Research Center
2710 W. Pine Grove Road
Pennsylvania Furnace, PA 16865
Social Media
2026 Event Information
Dates
August 11, Tuesday 9:00 a.m. - 5:00 p.m.
August 12, Wednesday 9:00 a.m. - 7:00 p.m.
August 13, Thursday 9:00 a.m. - 3:00 p.m.
Location
Russell E. Larson Agricultural Research Center
2710 W. Pine Grove Road
Pennsylvania Furnace, PA 16865


