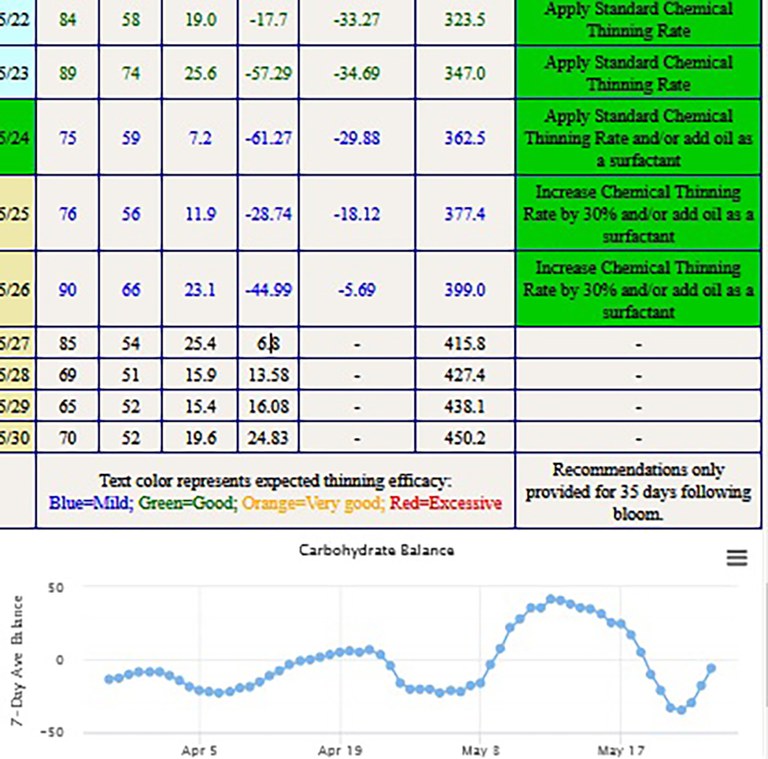
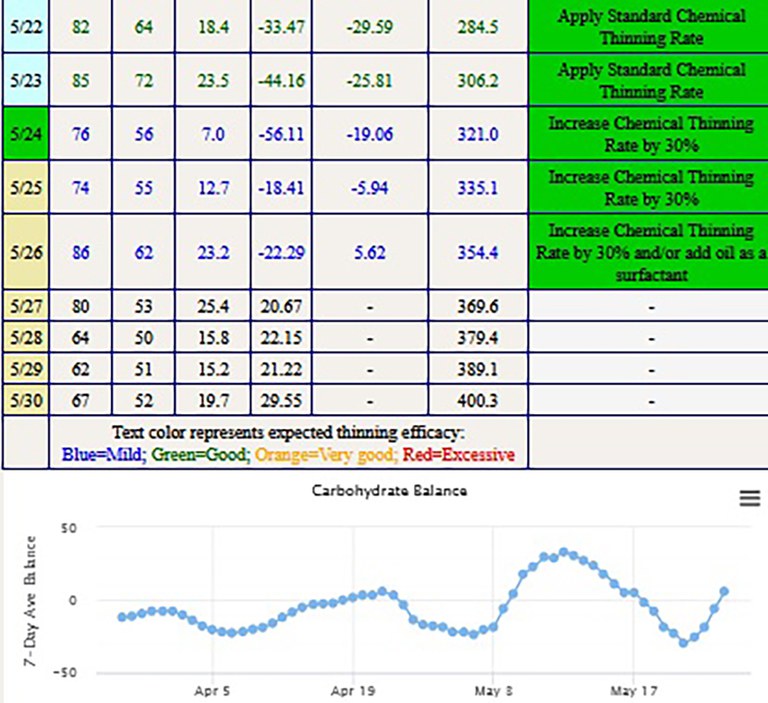
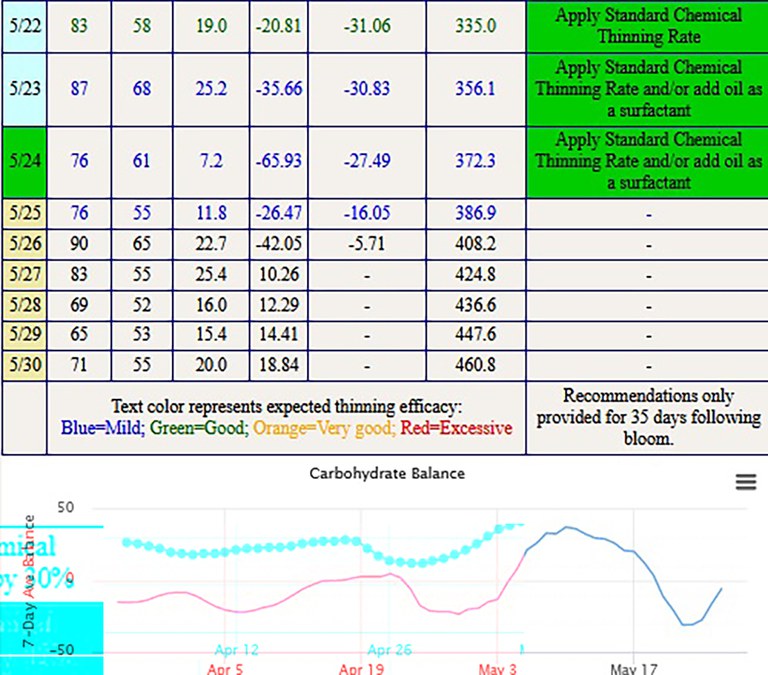
Apple Carbohydrate Thinning Model for Biglerville, Piney Mtn, and York Springs.
Biglerville
Green tip: March16, 2020
Full bloom: April 27, 2020
Date | Max Temp (°F) | Min Temp (°F) | Solar Rad (MJ/m2) | Production | Demand | Balance | 4-Day Avg Balance | Thinning Recommendation |
---|---|---|---|---|---|---|---|---|
1-Jun | 71 | 43 | 27.60 | 130.64 | 62.88 | 67.76 | 7.29 | Increase chemical thinner rate by 15% |
2-Jun | 74 | 48 | 11.60 | 71.63 | 71.18 | 0.45 | -20.44 | Decrease chemical thinner rate by 15% |
3-Jun | 88 | 63 | 19.00 | 86.73 | 106.34 | -19.62 | -16.83 | Decrease chemical thinner rate by 15% |
4-Jun | 87 | 67 | 20.60 | 90.63 | 110.06 | -19.44 | -0.54 | Apply standard chemical thinner rate |
5-Jun | 79 | 66 | 10.90 | 58.32 | 101.50 | -43.17 | 12.41 | Increase chemical thinner rate by 15% |
6-Jun | 85 | 58 | 25.10 | 114.93 | 100.03 | 14.90 | 25.59 | Increase chemical thinner rate by 30% |
7-Jun | 75 | 53 | 26.00 | 127.77 | 82.22 | 45.56 | 23.60 | Increase chemical thinner rate by 30% |
8-Jun | 79 | 57 | 26.30 | 125.62 | 93.27 | 32.35 | 13.34 | Increase chemical thinner rae by 15% |
9-Jun | 86 | 61 | 26.20 | 117.65 | 108.10 | 9.55 | - | |
10-Jun | 86 | 62 | 25.70 | 116.66 | 109.72 | 6.95 | - | |
11-Jun | 81 | 66 | 23.30 | 113.22 | 108.71 | 4.51 |
Piney Mountain
Green tip: March 21, 2020
Full bloom: May 2, 2020
Date | Max Temp (°F) | Min Temp (°F) | Solar Rad (MJ/m2) | Production | Demand | Balance | 4-Day Avg Balance | Thinning Recommendation |
---|---|---|---|---|---|---|---|---|
1-Jun | 69 | 45 | 24.40 | 117.83 | 63.16 | 54.67 | 2.31 | Increase chemical thinner rate by 15% |
2-Jun | 75 | 49 | 12.50 | 72.36 | 74.92 | -2.57 | -22.09 | Decrease chemical thinner rate by 15% |
3-Jun | 86 | 60 | 20.00 | 89.95 | 102.26 | -12.31 | -14.73 | Apply standard chemical thinner rate |
4-Jun | 83 | 65 | 16.20 | 75.35 | 105.89 | -30.55 | 1.57 | Increase chemical thinner rate by 15% |
5-Jun | 77 | 66 | 10.80 | 55.04 | 97.98 | -42.94 | 19.22 | Increase chemical thinner rate by 15% |
6-Jun | 81 | 55 | 25.20 | 116.04 | 89.18 | 26.86 | 35.49 | Increase chemical thinner rate by 30% |
7-Jun | 72 | 51 | 26.20 | 125.84 | 72.95 | 52.89 | 33.39 | Increase chemical thinner rate by 30% |
8-Jun | 76 | 56 | 26.40 | 123.67 | 83.61 | 40.06 | 25.54 | Increase chemical thinner rate by 30% |
9-Jun | 82 | 60 | 26.20 | 117.85 | 95.71 | 22.14 | - | |
10-Jun | 83 | 60 | 25.80 | 116.94 | 98.48 | 18.46 | - | |
11-Jun | 74 | 63 | 22.90 | 113.71 | 92.20 | 21.51 |
York Springs
Green tip: March 15, 2020
Full bloom: April 29, 2020
Date | Max Temp (°F) | Min Temp (°F) | Solar Rad (MJ/m2) | Production | Demand | Balance | 4-Day Avg Balance | Thinning Recommendation |
---|---|---|---|---|---|---|---|---|
1-Jun | 70 | 48 | 23.20 | 118.62 | 65.72 | 52.90 | 3.05 | Increase chemical thinner rate by 15% |
2-Jun | 74 | 51 | 11.10 | 69.08 | 75.54 | -6.47 | -20.26 | Decrease chemical thinner rate by 15% |
3-Jun | 86 | 63 | 19.00 | 91.34 | 105.06 | -13.72 | -14.00 | Apply standard chemical thinner rate |
4-Jun | 86 | 64 | 18.10 | 88.04 | 108.58 | -20.53 | 0.87 | Apply standard chemical thinner rate |
5-Jun | 78 | 66 | 11.00 | 61.61 | 101.92 | -40.31 | 14.11 | Apply standard chemical thinner rate |
6-Jun | 84 | 58 | 25.20 | 118.44 | 99.90 | 18.54 | 26.66 | Increase chemical thinner rate by 30% |
7-Jun | 76 | 53 | 26.20 | 129.78 | 84.02 | 45.77 | 24.35 | Increase chemical thinner rate by 30% |
8-Jun | 79 | 58 | 26.30 | 127.10 | 94.65 | 32.45 | 14.19 | Increase chemical thinner rate by15% |
9-Jun | 86 | 62 | 26.10 | 119.47 | 109.59 | 9.88 | - | |
10-Jun | 86 | 62 | 25.60 | 119.22 | 109.89 | 9.32 | - | |
11-Jun | 81 | 67 | 23.20 | 115.29 | 110.19 | 5.11 |
Note: Date printed in boldface is the date the model was run and is based on expected temperatures for that specific date and location.