Posted: June 1, 2023
This article explains the changes to the newly released tables in the Soil Fertility and Nutrient Management chapter of the Penn State 2023-2024 Agronomy Guide, and how those changes affect the nutrient management planning community when using the Nutrient Management Plan (NMP) or Nutrient Balance Sheet (NBS) planning tools.
You will notice updates to the following tables in the new Agronomy Guide.
- Table 1.2-10 – Typical Pennsylvania average daily production and total nutrient content of manure
- Table 1.2-11 – Residual nitrogen available from past manure applications based on historical frequency of application.
- Table 1.2-12 – Factors for calculating manure nitrogen availability based on time of application, incorporation, field history, and manure analysis with ammonium and organic nitrogen fractions.
The following changes will affect planners using the Agronomy Guide tables when entering manure nutrient book values into the planning tools.
Agronomy Guide Table 1.2-10
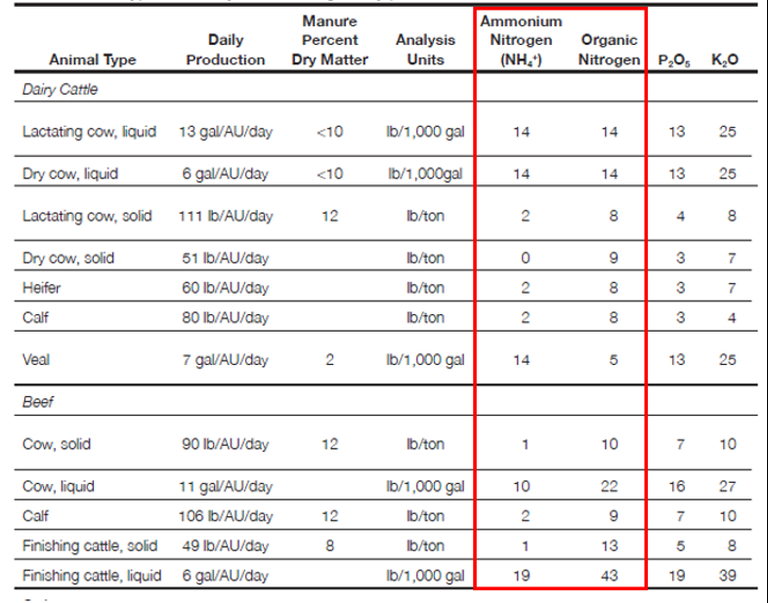
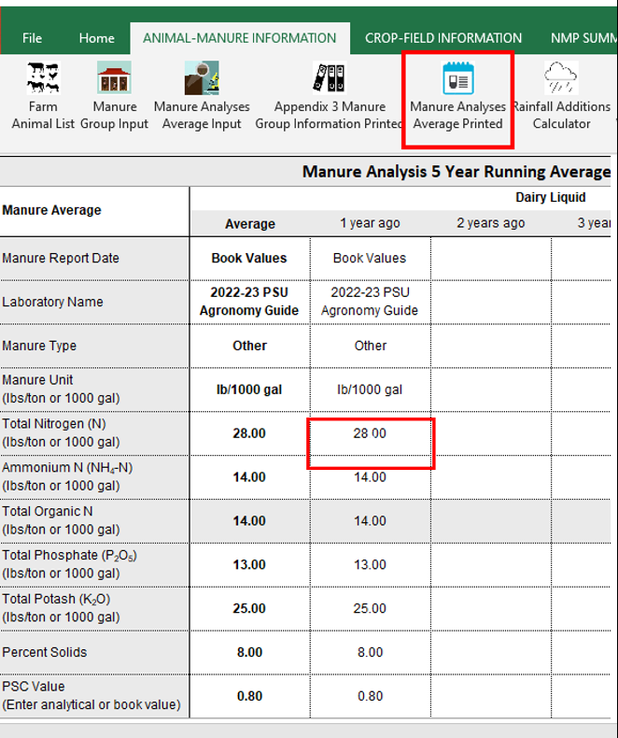
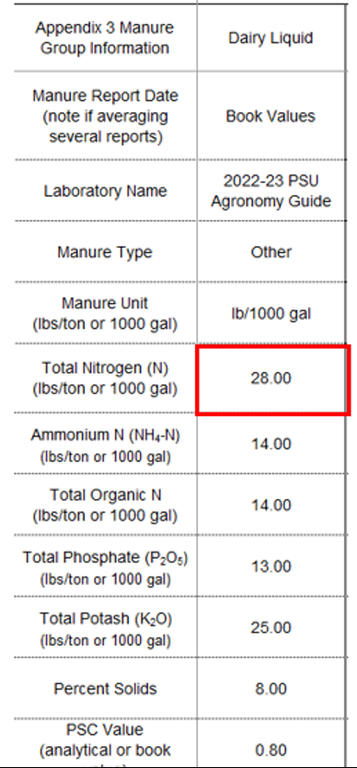
The book values for manure nitrogen are now listed as ammonium and organic nitrogen separately, instead of total nitrogen. What this means when entering manure nutrient content book values into a Nutrient Management Plan (NMP) or Nutrient Balance Sheet (NBS), is that the ammonium and organic nitrogen must be added together and entered as the total nitrogen in the NMP and NBS planning tools. The screenshots below show how a liquid cow manure with 14 lbs. ammonium N and 14 lbs. organic N per 1000 gallons should be entered as 28 lbs. total N in the NMP or NBS planning tools.
Table 1.2-10 – Typical Pennsylvania average daily production and total nutrient content of manure.
Nutrient Management Plan (NMP) - manure N information

Figure 1. Nutrient Management Plan - manure N average input

Figure 2. Nutrient Management Plan - manure average N printed
Nutrient Balance Sheet (NBS) - manure N information

Figure 3. Nutrient Balance Sheet - manure group N input

Figure 4. Nutrient Balance Sheet - manure group information
Agronomy Guide Table 1.2-11
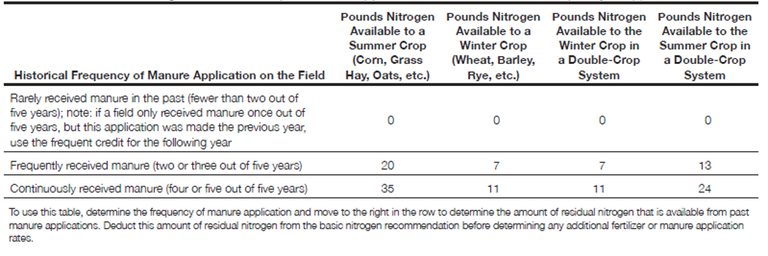
This table previously contained the manure nitrogen total nitrogen availability factors method. The table has been updated to list the residual nitrogen available from past manure applications based on historical frequency of application.
Table 1.2-11 – Residual nitrogen available from past manure applications based on historical frequency of application.

The current NMP and NBS planning tools still contain the Total N method for determining nitrogen availability and they can still be used when selecting the manure application season and application management.
Please take note: The NMP and NBS planning tools are planned to be updated and released by October 2023.
Beginning in October 2023, the nitrogen fractions method for determining nitrogen availability will be the sole method for determining nitrogen availability for manure in the year applied.
The Total N method for determining nitrogen availability will be removed from the planning tools.
The Total Nitrogen method for determining residual nitrogen available from past manure applications based on historical frequency of application will remain in the planning tools.


