A bar graph showing varying greenhouse gas emissions across three supply chain scenarios.
Cover of printer-friendly PDF version of Dairy Localization brief.
Chart showing the regional self reliance score for many animal and plant-based foods.
The cover of the printer-friendly version of the Regional Self Reliance brief. Links to pdf.
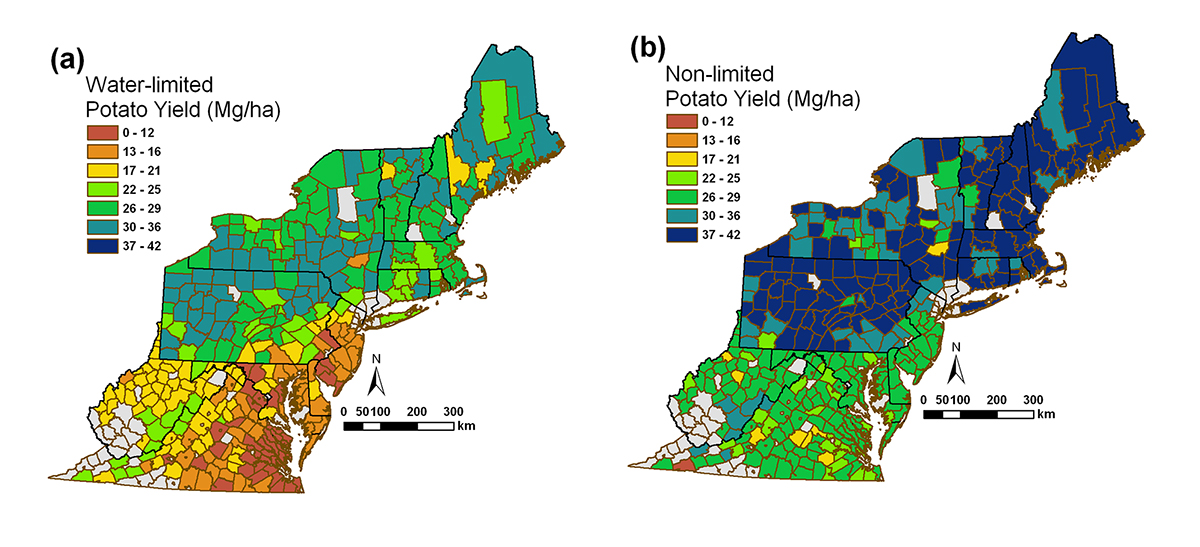
Average potato yield assuming (a) water-limited and (b) nonlimited conditions for each county in the Eastern Seaboard region.
The cover of the EFSNE brief on potato research.
Thumbnail of print material
Thumbnail of printed material.
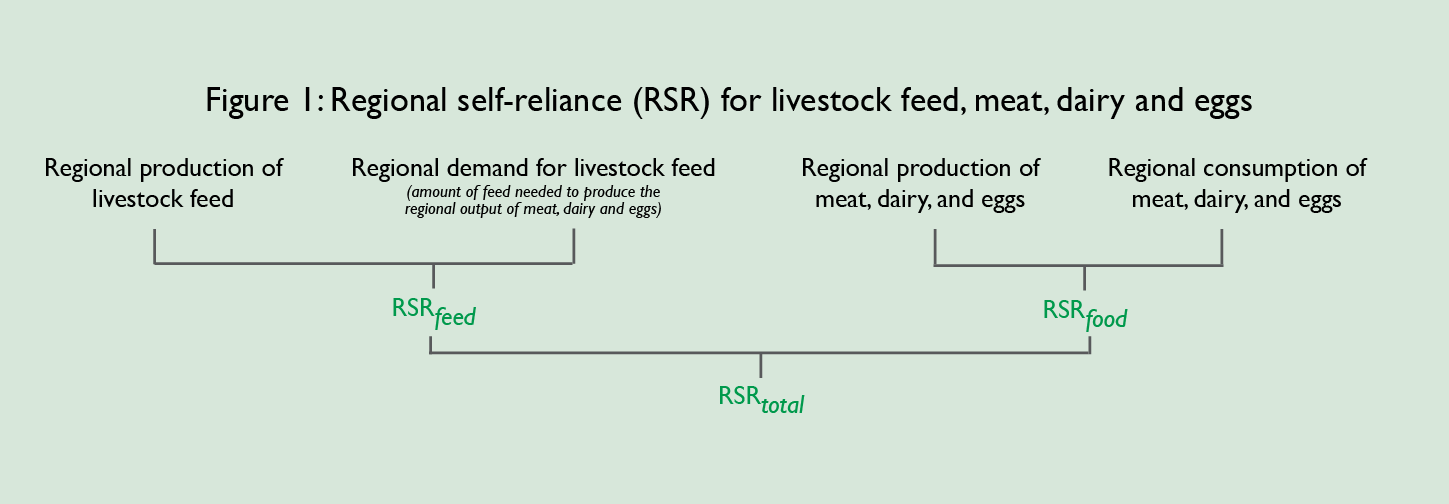
how the RSR feed and RSR food calculations are combined to come up with RSR total for meat, dairy, and eggs.
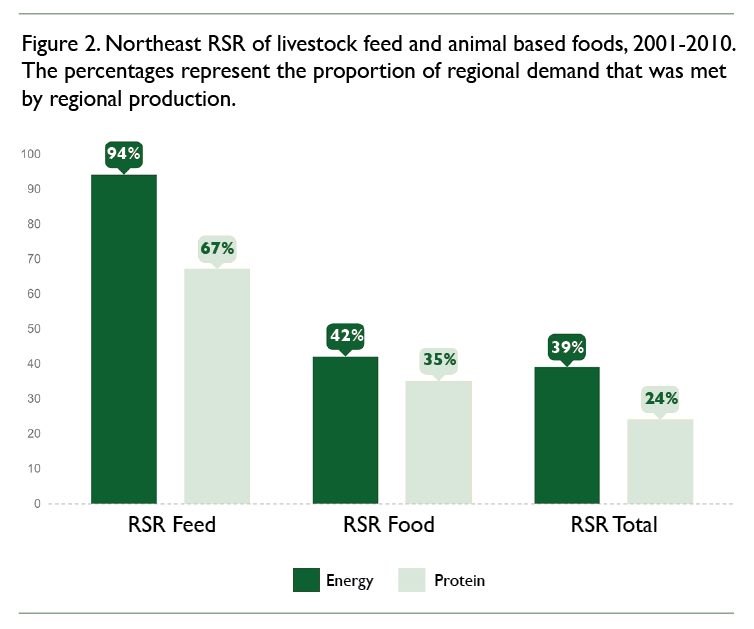
A bar graph showing the proportion of regional demand that was met by region production in terms of energy and protein.
Thumbnail of the cover of the printer-friendly version of this web page.
Cover of Outreach brief
Thumbnail cover of 4-page brief
front page of research brief
